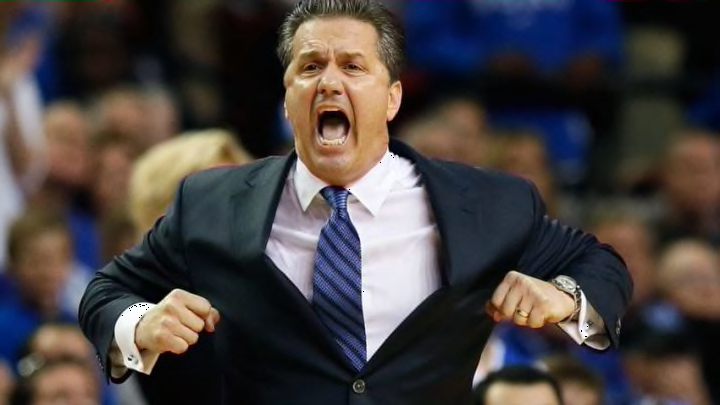
Coaching undeniably has an impact on which teams have success in March, but how do we measure this impact? Thanks to Barttorvik, there is finally a tool that lets NCAA Basketball fans begin to answer this question.
As the NCAA Tournament approaches, there is less and less time for college basketball fans to figure out which teams to back in March. There are plenty of factors to consider once the brackets are revealed: which teams are hot/not, what Vegas/analytics say, how teams matchup with each other, the “eye test,” etc. But here’s another factor that might be a bit underappreciated since it’s been difficult to measure: COACHING.
(All statistics used in this article were found via Barttorvik and KenPom).
The average college basketball fan will tell you there are good coaches and bad coaches, (the coach of their favorite team is likely bad 🙂 so it’s not as if people don’t think coaching is important. To some extent, however, I’ve long believed the coaches with the best players are going to “look like” the best coaches. For example, is Coach K really one of the best coaches ever? Or has he simply had really talented teams that have made him “look like” the best?
Like most things, the answer is likely somewhere in the middle. Any coach needs good players to succeed, but some coaches have gotten more out of their teams than others. So if we can agree this is the case, how do we figure out which coaches DO actually give their teams an edge, particularly in the NCAA Tournament.
For the first time, I actually found an analytical that attempts to accomplish this. Barttorvik.com has an algorithm that measures how coaches have performed in the NCAA Tournament. It measures this through two factors: “Performance Against KenPom Expectations” (PAKE) and “Performance Against Seed Expectations” (PASE). PAKE measures which coaches have performed the best in the NCAA Tournament relative to their KenPom ranking expectations. PASE measures which coaches have performed the best in the NCAA Tournament relative to their seed expectations. Overall, the rankings don’t simply reflect which coaches have won the most in March. Instead, they measure the ability of coaches to perform above expectations in the NCAA Tournament. I looked at every season from 2008-18. Here are the top ten coaches over that period in terms of PAKE and PASE.

Some of the above coaches, like Brad Stevens, Kevin Ollie, Frank Martin, and Porter Moser, weren’t particularly surprising to me, as each has clearly “over-performed” in the tournament with improbable Final Four runs. However, seeing big-name coaches like John Calipari and Roy Williams at the top of the list was very interesting to me. Most people regard these coaches as among the best in the game, but I wasn’t sure to what degree they were just benefitting from talented rosters.
The above rankings seem to indicate that not only have Calipari and Williams had talented rosters, they’ve had teams that have performed above expectations in the NCAA Tournament. We’ll never know the precise impact these coaches have on these performances, but this still tells us something. Next, I decided to filter out all the coaches that are no longer active, as only the active coaches are relevant for the upcoming tournament.

Bill Self, Mark Few, and Greg Gard find their way on to the list. Check out Barttorvik for the complete rankings. On the other side of the spectrum, here are some notable active coaches that rank the worst per PAKE.

Some of Tony Bennett’s poor ranking is driven by the UMBC loss last season. However, even before that loss, Bennett was ranked third to last among all eligible coaches in this metric. As much as the UMBC loss was in a sense an outlier, Bennett has had a larger history of underperforming in the tournament. I’m very high on Virginia this season, but this is definitely a bit concerning. Additionally, Rick Byrd has had an incredible run at Belmont but has yet to snatch a tournament victory. The Bruins are projected to get another shot this season.
I found an interesting dynamic when it comes to Duke’s Coach K. Although most coaches had fairly similar PASE and PAKE rankings, Coach K had one of the larger disparities I saw: PASE of 238th and PAKE of 48th. This suggests that Coach K’s teams have performed above expectations relative to how “good the team actually is” but have underperformed relative to how they’ve been seeded.
Although Duke’s resumes may have warranted their seeding, it appears that the Blue Devils have often been over-seeded relative to how good they “actually are,” at least according to KenPom. In terms of evaluating Coach K as a tournament coach, I think it’s most accurate to defer to the PAKE ranking.
When it comes time to fill out your brackets, there are countless factors that can be considered, but don’t forget about the impact of coaching. It might be difficult to measure the exact effect coaches have, but the influence is undeniably there. Barttorvik provides a great tool to begin to measure this influence.
