While the playoffs have yet to officially kick off (the play-in doesn’t count), the NBA Draft is only a couple of months away (July 29th). There are countless ways to evaluate the top prospects, but ShotQuality is a tool everyone should add to their arsenals.
While the site offers several advanced statistics, its most notable metric is yes, Shot Quality (“SQ”). SQ provides the expected number of points for a player/team’s shot attempt, using over 90 different variables to do so — most importantly each individual player’s shot-making ability. The multitude of variables includes some less obvious factors, such as the likelihood of an offensive rebound after a given shot attempt. Check out the “Stats Explained” section if want to dive into more detail.
In the meantime, however, what insights can ShotQuality provide about the 2021 NBA Draft class? Are any players overrated? Underrated?
It’s no secret that the “analytics” are fond of shots at the rim and beyond the arc. Among 94 players ShotQuality classifies as draft prospects (withdrawal deadline is July 19th), which players took these at the highest rates last season?
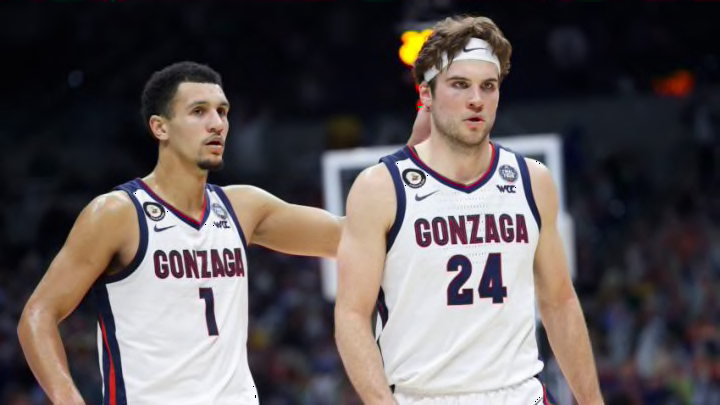
Alabama’s Jaden Shackelford led the way, with 86% of his attempts coming at the rim or from downtown. A Potential lottery pick in Gonzaga’s Corey Kispert wasn’t far behind him at 84%.
Players with these “analytics-friendly” shot diets have a leg up when it comes to faring well in SQ. As the below chart illustrates, prospects that take more shots at the rim and from three tend to have a higher expected points per possession on their field goal attempts.
But regardless of where a player takes their shots, some are obviously better at making these shots than others. “Three” might be worth more than “two”, but if a player shoots 20% from long-range, it isn’t helping their team. And despite the shortcomings of the midrange, an elite shooter from this area should be encouraged to keep letting them fly.
As a result, some prospects with seemingly “efficient” shot selections fared poorly in SQ, and some with seemingly “inefficient” shot diets fared well. What jumps out below?
(Click on chart and then hover over dots to see every player)
- Corey Kispert: The sharpshooter’s 84% “rim and three” rate make his great SQ not entirely surprising, but he performed WAY above the trend line last season. Hitting 44.0% of his threes and 74.8% of his attempts at the rim wasn’t too shabby.
- Luka Garza: The fact the National Player of the Year managed to have this strong of a SQ score on “so-so” shot selection…makes him very worthy of all the hardware he received last season. Garza made 69.5% and 44.0% of his shots at the rim and from three, but what about the ~40% of shots he wasn’t taking from these areas of the floor? The forward wasn’t elite from midrange (38.8%), so his SQ must have been driven by his soft touch near the basket on attempts near, but not quite at the rim.
- One player that outperformed his shot selection? Utah State’s Neemias Queta. One player that underperformed? North Carolina’s Caleb Love.

A More Accurate Assist Metric
How does one evaluate which prospects are the best passers and playmakers? When it comes to statistics, assists have historically been the No. 1 (and really the only) option. But when one stops to think about it, assists is a VERY flawed measure of a prospect’s playmaking ability. Even if a player makes an incredible drive and pass, they don’t get any credit for it in the boxscore if their teammate on the receiving end doesn’t knock down the shot.
This is where “SQ assists per game” (“SQ Assists”) comes in handy. If Player A makes five passes to Player B, and each of Player B’s shots has a 50% chance of going in, Player A is credited with 0.5 SQ Assists after each shot. This way, if Player B has an off night and goes 0/5, Player A still gets the “assists credit” they deserve.
On the flip side, if Player B catches fire and goes perfect from the floor, awarding Player A five assists would likely overstate their playmaking contribution. This is accounted for as well, as both scenarios would result in the same number of SQ assists.
47/94 prospects averaged at least two assists per game last season. Accounting for SQ, which players deserved more assists than they averaged, and who deserved fewer?
Eight of the 47 prospects averaged >= 10% more SQ Assists per game than their actual assists per game average. The potential No. 1 pick in Cade Cunningham tops the list. His teammates underperformed expectations on the shots they took after he passed to them, and the data suggests Cunningham “deserved” to average one whole extra assist per game.

14 of the 47 averaged >= 10% more actual assists than SQ assists. The differentials are rather small, however, topping out at 0.6 more assists than “deserved” for West Virginia’s Miles McBride and Virginia’s Reece Beekman.

While incorporating ShotQuality’s metrics likely won’t turn an average draft scout into a stellar one, there is clearly value to analyzing the game in these unique ways. Assists, in particular, is a statistic that has very much been in need of improvement for some time now.
(Credit to ShotQuality and hoop-math for statistics and Big Ten Network for GIF)
